SPLAT
(Stereo-PLastic Analysis Tool)
Software Package for
STEREO-PLASTIC
Version 1.0.0 03/09/2007
1. Introduction
SPLAT is a software package for
the data-analysis of the STEREO PLASTIC instrument. It is written in IDL and
uses the Berkeley TPLOT graphics package (by Davin Larson http://sprg.ssl.berkeley.edu/~davin/). This package provides the data extraction and
processing routines which are initiated by the use of crib-sheets. Once the
data are loaded in the IDL memory, tplot functions are used to plot the data.
The crib-sheets provided, are generic idl scripts that are used to load particular
data products. This version of the software represents the current state of the
PLASTIC software at UNH.
SPLAT runs on PLASTIC Level 1 data.
All Level 1 is available in CDF format through the Stereo Science Center:
http://stereo-ssc.nascom.nasa.gov/data/ins_data/plastic/
Level 1 Data Contact: Dr. Lorna Ellis ( lorna.ellis@unh.edu
)
The SPLAT Software can be found at:
http://stereo-ssc.nascom.nasa.gov/software.shtml
SPLAT Contact : Dr. Chris Mouikis (chris.mouikis@unh.edu)
2. Installation
2.1. System Requirements
SPLAT has been developed in
IDL6 in a Linux-Unix environment. SPLAT should work on any Unix and Unix based
(MAC OSX) system. Porting to other platforms is not currently planned but is
possible. Filenames & paths follow the UNIX naming convention.
2.2. Folder Structure
SPLAT is delivered as a
zipped file (splat.zip). Unzip
this file using an unzip utility or the following unix command:
unzip splat.zip
A folder, named splat, is then installed in the current directory. Under
this folder the following folders/files can be found:
- A README file with a quick-start description on how to
get started with splat.
- A Doc folder that contains the splat manual and a set
of html files that list all the procedures/functions and the relevant
documentation as provided at the file header.
- A cal_data folder that contains the PLASTIC calibration
files (this will be updated as requred)
- The folder splat_v1.0. All the processing routines are in this
folder. In principle, there is no need to edit any of the files in this
folder. The processing routines are written in a fairly transparent way,
with a lot of comments that should allow anybody with some IDL programming
experience to read them. In case a bug is found or an improvement is
needed we would like to be informed so that we can include the
corrections/improvements in a new version. The splat_v1.0 folder is
comprised of three subfolders: splat_core that contains all the SPLAT data extraction and
processing routines, splat_util that contains utility procedures/functions usable with SPLAT, and splat_tplot that contains all the tplot (graphics functionality) routines.
- The folder splat_user. This folder is each user's personal folder and
contains: the splat.sh
start-up script, a list of crib-sheets for the creation of different
products and a number of subfolders for the better organization of SPLAT
related tasks. The crib-sheets are IDL scripts that call the main
processing routines for the creation of a particular product (i.e. energy
spectrum, moments and etc.) Once these products are created, they are
stored in memory and can be plotted using the TPLOT routines.
2.3. Editing splat.sh
start-up script
Each user has to edit the splat.sh start-up script in the splat_user folder. The splat.sh script is a c-shell script setting environment
variables for all software and data paths. In the example script included, it
is assumed that both splat_user
and splat_v1.0 directories are
installed in the user's home directory under the directory splat. The user has to ensure that all software paths
defined in this file are valid. Data paths need to be valid if they are to be
used for the creation of a particular product. Here is a description of the environment
variables that are set by the splat.sh script (only highlighted variables are
the ones that need to be edited if the default setup is kept):
- SOFT: path of where the directory splat is
installed. Here the user home directory is assumed.
- SPLAT: path to the splat directory.
- SPLAT_USER: path to the splat_user directory.
- IDL_PATH: It requires that the IDL_PATH environment
variable is set (which is usually the case - typing the command: echo
$IDL_PATH in the unix command line should return the idl path) and it
updates the IDL_PATH to include the splat software.
- STA_PLA_L1DATA: path to plastic Level 1 CDFs directory for spacecraft A.
- STB_PLA_L1DATA: path to plastic Level 1 CDFs directory for spacecraft B.
- PLACAL: the path to the calibration files.
- SPLAT_TEMP: path to a temporary directory. This directory
is used for splat internal purposes and because of this, the splat_temp
path has to be valid. By default it points to the splat_user/tmp
directory.
- OUT_DIR:
Points to the directory where plots can be stored. This is not used
extensively. Most of the time plots are saved locally.
- ERROR_LOG: if set to on it writes a separate error log file in the splat_user/error_log
folder for every idl session. The default setting is off.
- IDL_STARTUP: runs the splat_startup script when idl is
started.
3. SPLAT Usage
Once the start-up script splat.sh file is properly edited the user has to:
- execute the splat.sh using the following unix command: source
splat.sh (the usage of the tcsh
or csh is assumed). In each unix window (unix command line session) this
shell should be executed only once
- Start IDL
- From the IDL-prompt execute the SPLAT
crib-sheets. For example in
order to execute the crib-sheet for the creation of energy spectra, type
in the IDL-prompt: @pla_en_spec_crib. Available crib-sheets are described in the next section.
Once the crib-sheet is executed tplot commands can be used to display
the data. Here is a very basic list of tplot commands. These commands should be
executed in the idl command line after data products are loaded.
- tplot_names: it lists the tplot variables that are loaded in the IDL memory.
The name or the number of the tplot variable listed, should be used in
order to refer to a particular variable.
- tplot: Assuming that four tplot variables are loaded, these can be
plotted using: tplot,
[1,2,3,4]. Different order of the numbers can be used in order to change
the order that the variables are plotted.
- ylim, zlim: to adjust the y range of a tplot variable, type: ylim, 2, 1e1,
4e4, 1 where 2 is the tplot variable number, 1e1 is the minimum value, 4e4
the maximum value and 1 for log axis. For the z axis the zlim command
should be used instead.
- tlimit: to zoom in a plot using the mouse. tlimit, 10, 12 should be used
to specify the time interval between 10 and 12 UT. tlimit, 0, 0 should be
used in order to get the maximum time interval available.
- popen, pclose: to create a ps file. First plot on the screen
the plot using any combination of the above commands, then type: popen, 'filename.ps', then type: tplot and finally type: pclose
The _example_crib file, included in the splat_user directory,
3.1. SPLAT Crib-Sheets -
DESCRIPTION OF CRIBS AND INPUT PARAMETERS
Crib-sheets are sets of
IDL-code calling SPLAT main-level plot routines. A set of example crib-sheets
is contained in the splat_user
folder. A crib-sheet is executed by typing @crib-sheet-name at the IDL prompt. This will load all requested data
into tplot variables and will
produce a plot on screen.
3.1.1. MOST COMMON INPUT
PARAMETERS
time: Start date/time string in tplot format ('yyyy-mm-dd/hh:mm:ss')
Example: time = '2007-01-20/00:00:00'
timespan: Set the time span (duration). One of the following
keywords has to be used: SECONDS, MINUTES, HOURS, DAYS (DEFAULT)
Example: timespan, time,
1, /DAYS
sat: Satellite id ('A' or 'B'). An array of strings
indicating the s/c
Example: ['A',
'B']
moments: Moment to be calculated. The following
abbreviations should be used 'D': Density, 'V': Velocity, 'T': Temperature
'P': Pressure, 'J': Flux, 'E': Energy Flux. The sat, specie and moments arrays must have exactly the same number of element
energy: Energy range (200 - 87000 eV) [energy_min,
energy_max]
Example: energy = [1000,
10000]
theta: Deflection angle range (-25, 25 degrees)
[theta_min, theta_max]
Example: theta = [-25,
25]
phi: Position angle range (-25, 25 degrees) [phi_min, phi_max]
Example: theta = [-25,
25]
units: Units options: 'Counts', 'c/s''
Example: units = 'Counts'
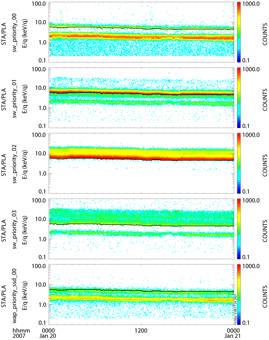
3.1.2. pla_en_spec_crib
To plot PLASTIC energy
spectra (quantity vs. energy vs. time)
INPUT PARAMETERS: product, time, timespan, units
Possible products are:
# SOURCE ARRAY
REDUCED
ARRAY CLASSIFIER
01:
SW-all
:
h_alpha
02:
SW-H(D)
:
h+peak
03:
SW-alpha(D) :
he++peak
04:
SW-alpha(T) :
he++trc
05: SW
Z>2
:
sw_z>2_h
class:0-1
06: SW
Z>2
:
sw_z>2_l
class:0-12
07: WIDE
ANGLE
:
wap_ssd_tcr class:0-14
08: WIDE
ANGLE(D) :
wap_ssd_dcr class:0-6
09: WIDE
ANGLE(D) :
wap_no_ssd_dcr class:0-6
10: SW
PHA PRIORITY RATES :
sw_priority class:0-3
11: WAP
PHA PRIORITY RATES :
wap_priority_ssd
class:0-1
12: WAP
PHA PRIORITY RATES :
wap_priority_no_ssd class:0-1
PRODUCT
INPUT EXAMPLES:
prod =
'A1'
-
S/C A, product 1
prod = 'B07/0-14' -
S/C B, product 7,
classifiers 0 to 14
prod =
'B5/0-1' - S/C
B, product 5, classifiers 0
& 1
prod =
'A10/0,2-3' -
S/C B, product 10, classifiers 0 &
2 & 3
KEYWORDS: diagn
– it creates the corresponding s-channel plot (over-plotted line in
following plots).
3.1.3. pla_en_spec_line_crib
To plot PLASTIC quantity vs.
time line plots for a particular energy range.
INPUT PARAMETERS: product, time, timespan, units, energy
The inputs are the same as
the ones described for the energy spectra (3.1.2). An additional input is the
energy range (3.1.1) over which the energy spectrum is integrated.
KEYWORDS: diagn
– it is not used yet.
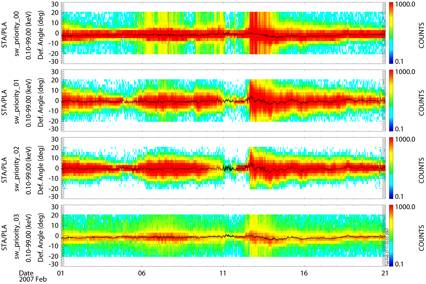
3.1.4. pla_def_spec_crib
To plot PLASTIC deflection
spectra (quantity vs. deflection angle vs. time)
INPUT PARAMETERS: product, time, timespan, units, energy, phi
The inputs are the same as
the ones described for the energy spectra (3.1.2). An additional input is the
energy range (3.1.1) over which the energy spectrum is integrated (and the phi
range (3.1.1) which is not used yet).
KEYWORDS: diagn
– It creates the corresponding average deflection plot (over-plotted line
in following plots)
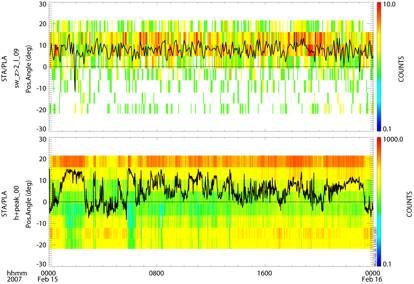
3.1.5. pla_pos_spec_crib
To plot PLASTIC position
spectra (quantity vs. deflection angle vs. time)
INPUT PARAMETERS: product, time, timespan, units, energy, theta
The inputs are the same as
the ones described for the energy spectra (3.1.2). An additional input is the
energy range (3.1.1) over which the energy spectrum is integrated (and the
theta range (3.1.1) which is not used yet).
KEYWORDS: diagn
– It creates the corresponding average position plot (over-plotted line
in following plots)
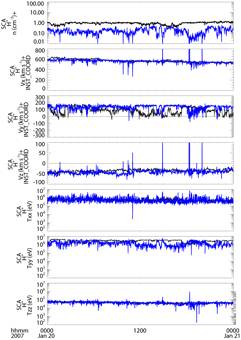
3.1.6. pla_obmom_crib
To plot PLASTIC on-board
moments (quantity vs. time)
INPUT PARAMETERS:
sat_moment, time, timespan
Possible
moment products:
D: Density
VX: Velocity
Vx component
VY: Velocity
Vy component
VZ: Velocity
Vz component
VXYZ: All
three velocity components
VT: Velocity
Vtotal component
TXX: Temperature
xx
TYY: Temperature
yy
TZZ: Temperature
zz
TXXYYZZ: All three
temperature components
PXX: Pressure
xx
PYY: Pressure
yy
PZZ: Pressure
zz
PXXYYZZ: All three
pressure components
sat_moment
input examples:
sat_moment
= ['A_D', 'B-D']
sat_moment
= ['A_D', 'A_VX', 'A_VY', 'A_TXXYYZZ']
Note: For
this version of the software one input per spacecraft will load all moments.
Therefore the first example:
sat_moment = ['A_D', 'B-D’' will load all moments for both
spacecraft. After the crib-sheet is executed using the tplot_names command will show the list of all
the moments.
KEYWORDS: INST_COORD: moments are calculated in instrument
coordinates
In the following figure
on-board moments from STA (black) and STB (blue) are plotted.
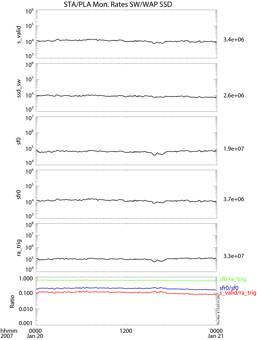
3.1.7. pla_mon_crib
To plot PLASTIC monitor
rates (quantity vs. time)
INPUT PARAMETERS:
sat, sat_mon, e_step, time, timespan, units, no_eng,
Possible sat_mon products:
's_valid'
's_e_not_req'
's_e_req'
's_no_pos'
's_mult_pos'
's_no_e'
's_mult_e'
'ra_sat_a'
'ra_sat_b'
'ra_sat_both'
'ssd_sw'
'ssd_st'
'sf0'
'sfr0'
'stp0'
'ra_trig'
'pos1_0'
'pos1_1'
'w_no_pos'
'w _mult_pos'
'w _valid'
'sf2'
'sfr2'
'stp2'
'pos2_0'
'pos2_1'
'pos2_2'
'pos2_3'
'pos3_0'
'pos3_1'
'pos3_2'
'pos3_3'
'stop0' sfr0/stp0
'stop2' sfr2/sf2
'start2' sfr2/stp2
sat_mon input
examples:
sat_moment
= ['s_valid', 'ssd_sw', 'sf0', 'sfr0', 'ra_trig'] (following plot)
Possible e_step values:
are from 0
to 31. Each e_step value corresponds to 4 energy bins (from the 0-127 energy
bins). e_step = 32 will return the whole energy range.
3.1.8. pla_mon_full_crib
To plot PLASTIC monitor
rates for full energy range (quantity vs. time)
Same input parameters as
above. The e_step takes values from 0 to 127.
3.1.9. pla_mon_crib
To plot PLASTIC monitor
rates (quantity vs. time)
INPUT PARAMETERS:
sat, sat_mon, e_step, time, timespan, units, no_eng,
3.1.10. pla_hk_crib
To plot house keeping
parameters (parametrer vs. time)
INPUT PARAMETERS: sat, sat_hk
The list of the available
housekeeping parameters is included in the crib-sheet
3.1.11. pla_hk_crib
To plot house keeping
parameters (parametrer vs. time)
INPUT PARAMETERS: sat, sat_dig_hk
The list of the available
housekeeping parameters is included in the crib-sheet
3.1.12. pla_hk_crib
To plot house keeping
parameters (parametrer vs. time)
INPUT PARAMETERS: sat, sat_sc_hk
The list of the available
housekeeping parameters is included in the crib-sheet
4. Trouble Shooting
If program execution stops with
an error message, examine all the output message lines. In addition, an error
log file is kept under splat_user/error_log. Quite often the error is related
to missing data files or products. In some cases you might resume execution by
returning from a subroutine: Type RETURN or RETURN,0 for that purpose,
otherwise RETALL will bring you back to the main level, from where you can
restart with corrected parameters.